Building an AI SOC for my SaaS projects
RUWazuh, ClickHouse, and AI agents instead of a security team

Denis Zuikov
· 13 min read
In recent years, like many people, I’ve been building my own small projects. And you’d think that if a project is small, its infrastructure is simple too. But even if you keep your frontend on Vercel and your database in Supabase, you still have Vercel and Supabase themselves, plus GitHub, Stripe, a DNS admin panel, email, a service for sending emails to users, the API of some LLM, etc. And every service has its own admin panel, its own tokens and its own logs.
For my latest project I decided to keep the backend on VPSs in Contabo cloud, and over 8 months of development it grew to three servers and a dozen or so services around them.
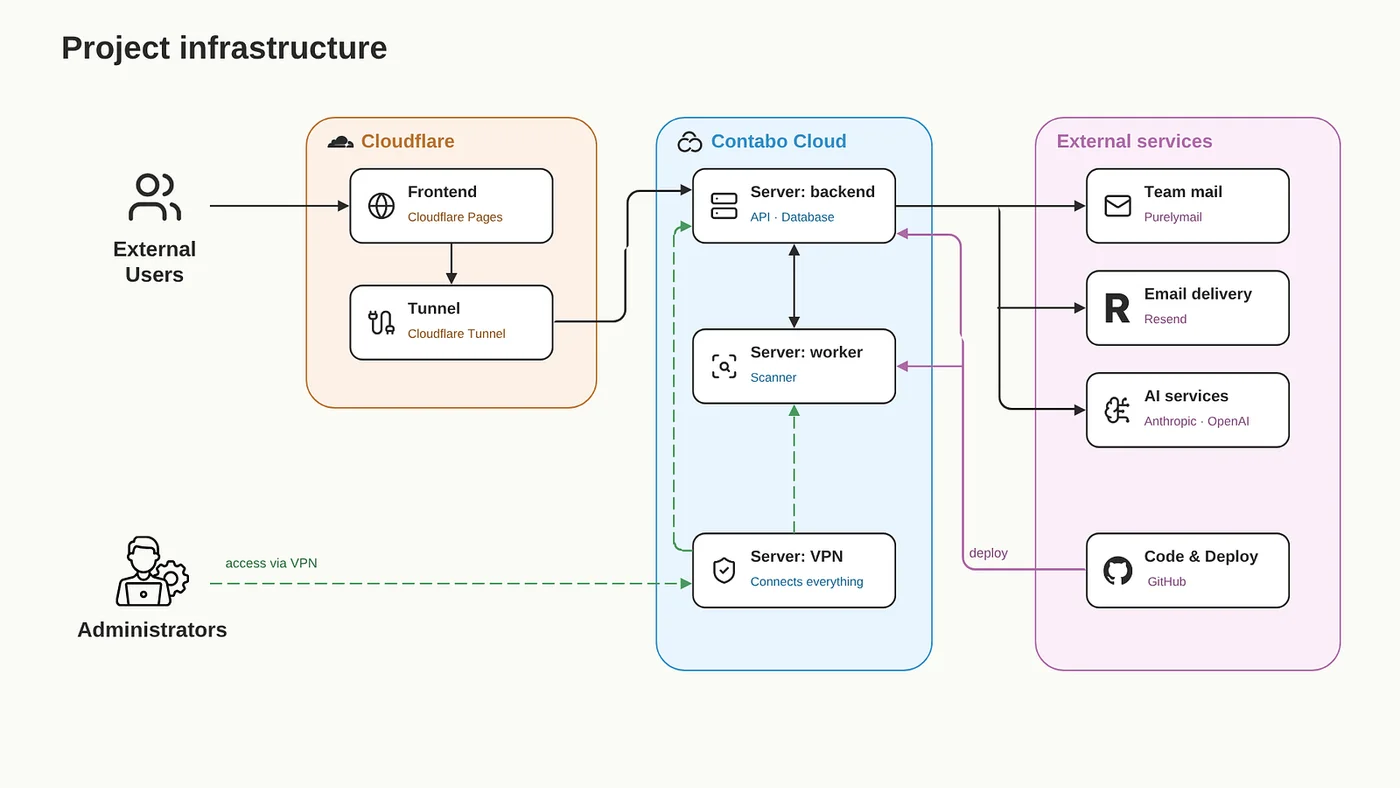
Of course, for every project I always do basic security hardening, set up uptime monitoring and two-factor authentication, and pay close attention to access rights. But with my security background, I always wanted to see and control more, and ideally everything that happens in the infrastructure. I want to know whether someone got access to my server, whether someone stole my LLM token, whether someone is brute-forcing a database that I accidentally exposed to the internet.
Working at a big company, I got used to the fact that there’s always a Security Operations Center (SOC), where 10+ people sit, collect logs from all nodes, analyze them and respond to threats 24/7. And even if you made some security mistake, they will notice either the mistake itself or the fact that someone is exploiting it. And having that SOC really creates a feeling of security and control. In my own projects I miss this: nobody monitors everything… well, except me, and even that with questionable quality.
And it seems that now is exactly the time when one person can actually solve this problem, by delegating all the dirtiest work to AI and focusing on the core security functions and architecture. I decided to give it a try, because on your own small project you can easily experiment, give more permissions for response, use AI more boldly and give it more freedom than is acceptable in a large infrastructure.
When I was planning it, this is what I had in mind:
- the SOC must live on one server;
- I should get few alerts, only about really important things;
- the system should learn from my answers on its own;
- absolutely all infrastructure components must be covered by monitoring;
- there should be a single place where I can ask any question about what’s going on in the project: who created a new server, who issued a new repository access key and why, what the tokens were spent on, etc.;
- at the very least the SOC must detect security incidents, and ideally respond on its own.
So, the task is set, let’s start building.
BUILDING
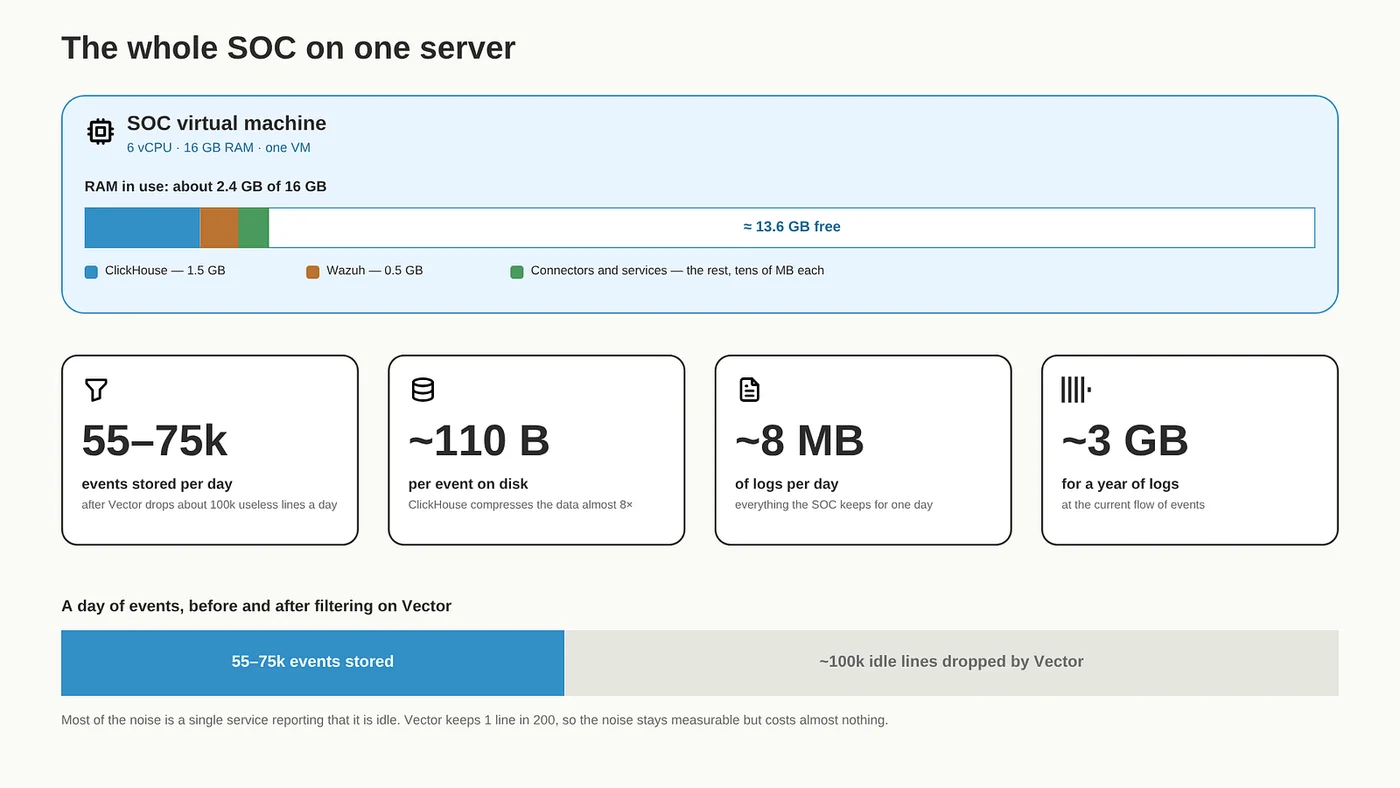
First, I’ll tell you what architecture I chose and what I’m going to build on. As I said, I wanted everything to fit on one server, so for the SOC I set aside a separate VM with 6 vCPU and 16 GB RAM.
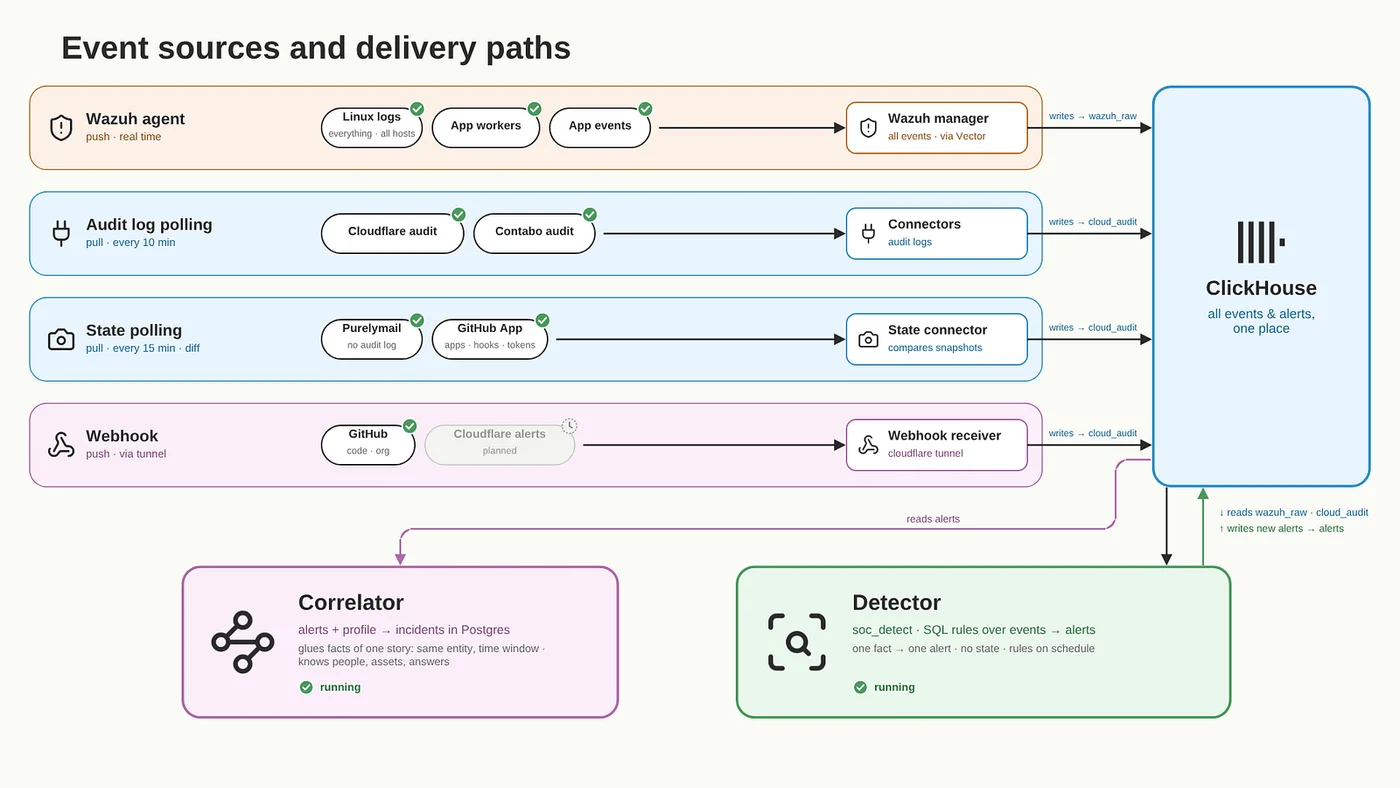
I built event collection from the servers on Wazuh: it already does a great job collecting logs and generating alerts, has a base of ready-made rules and lets you write your own, so there’s nothing to vibe-code in this part. But the Wazuh indexer on OpenSearch, which comes bundled with it, I decided not to use: for one server it’s too heavy and quite slow, it’s Java. So for now Wazuh remained only the thing that collects events and generates alerts.
And for storing events and alerts I chose ClickHouse. It lets me store events compactly and run queries for complex investigations fast.
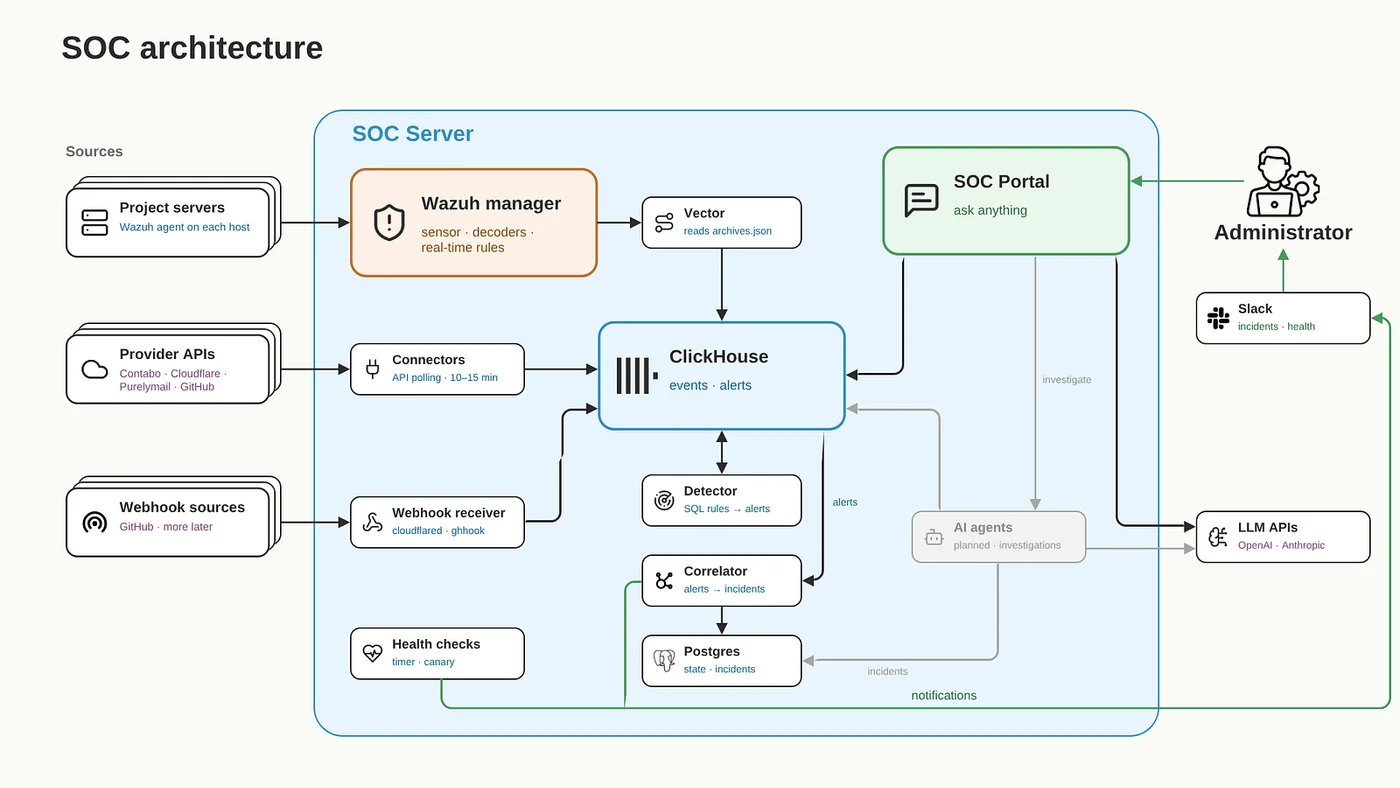
I connected ClickHouse and Wazuh via the archives.json file. Wazuh writes all events and alerts to this file. Then Vector reads this file, and the events go into ClickHouse. With this setup we get the main advantages and groundwork of Wazuh, but we don’t use the slow OpenSearch database and can run fast and efficient queries on ClickHouse.
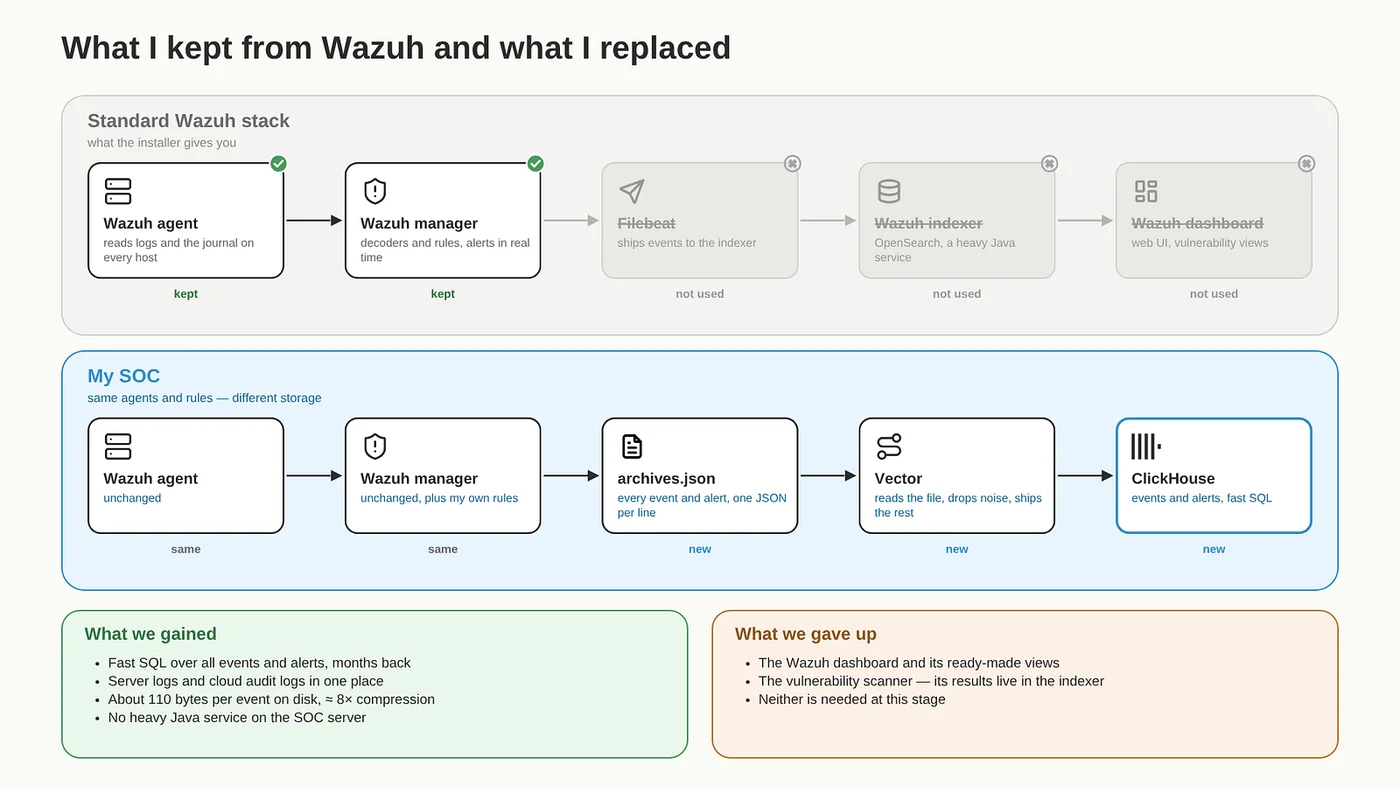
True, we lose some Wazuh functionality, for example the vulnerability scanner and the dashboard, but at this stage we don’t need it.
For some cloud services there’s no way to collect logs with Wazuh, because they have to be either polled via API or deliver information via webhooks, and Wazuh has no ready-made modules for such services. So for them I had to develop connectors that run on a schedule and go fetch the information from the sources themselves: small, self-written, each one a separate container and a couple hundred lines of Python. Most of them go to the API every 10–15 minutes on their own and write to ClickHouse. The SOC has no ports open to the outside: agents send events inside the VPN, and connectors fetch the data themselves. GitHub is trickier: on the free plan it can only push events via webhooks. So the receiver is hidden behind a Cloudflare tunnel: the SOC itself establishes an outgoing connection to Cloudflare, and GitHub’s requests come through it.
These events get into ClickHouse bypassing Wazuh, so it wasn’t possible to have Wazuh as the single place for generating alerts, and I had to write a separate detector that periodically runs queries in ClickHouse according to detection rules and writes back to ClickHouse, into the alerts table. None of the open-source projects fit my criteria, and I had to write my own. The closest one was ClickDetect. Maybe I’ll come back to it later.
And on top of all this runs the correlator. It looks at incoming alerts and decides: open a new incident, add the alert to an already open one, or not open an incident at all. The correlator determines urgency, asks admins in Slack when needed, and keeps the history of each incident. In the next articles I’ll tell you about my experiments with developing AI agents for incident investigation (collecting additional logs, running commands, response, etc.).
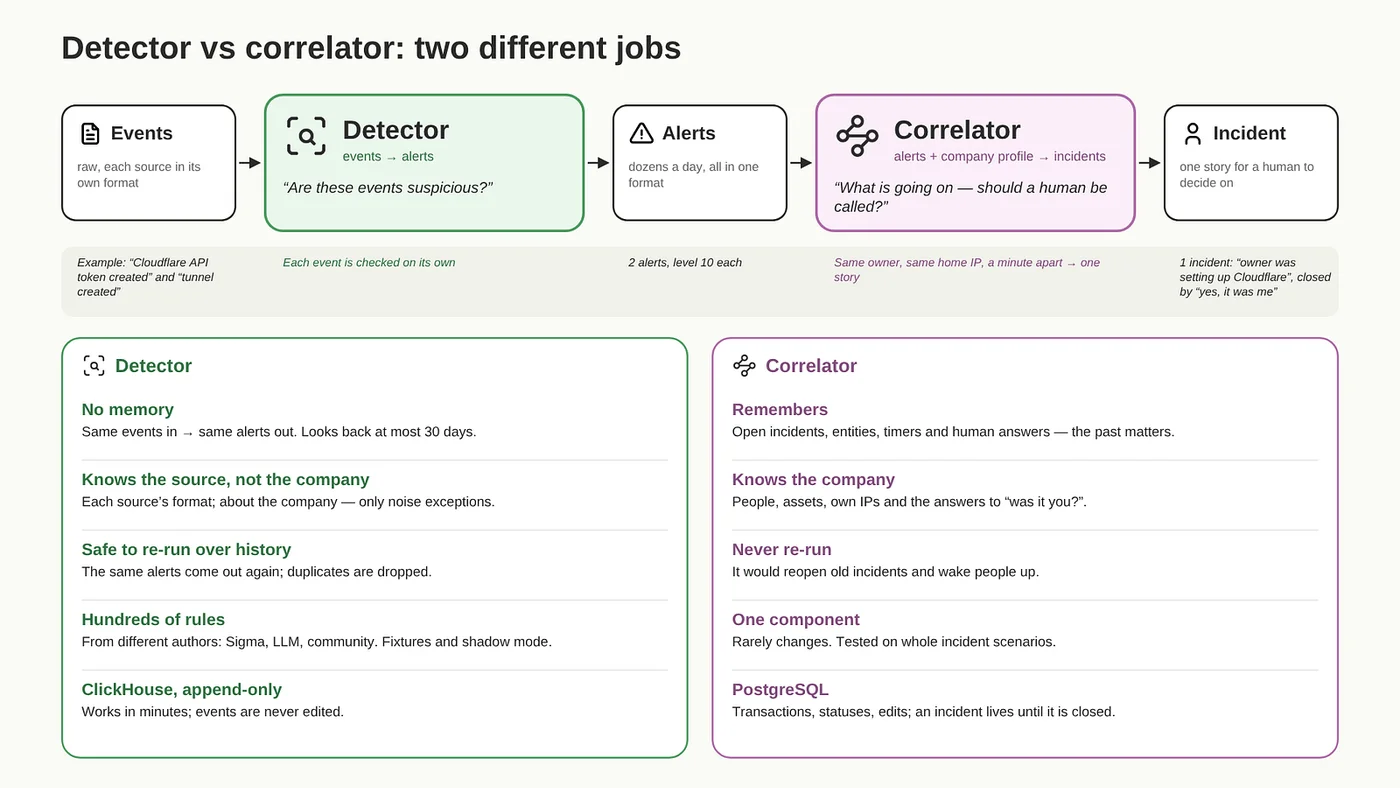
Everything related to incidents is stored in PostgreSQL. The incidents themselves with their statuses (open, in progress, contained, closed), which alerts went into them, the participants — IP addresses, users, keys, hosts, the timeline of each incident, questions to people along with the answers, and response actions — all this is data that constantly changes, so it’s exactly a job for a relational database. Events and alerts stay in ClickHouse. When an incident is closed, it turns into a Markdown report and goes into the git repo.
On top of all this there’s a SOC portal where you can ask any question about what’s going on in the infrastructure in free form. The answer comes as plain text together with the data it’s based on. In the future you’ll also be able to start a new investigation from here yourself.
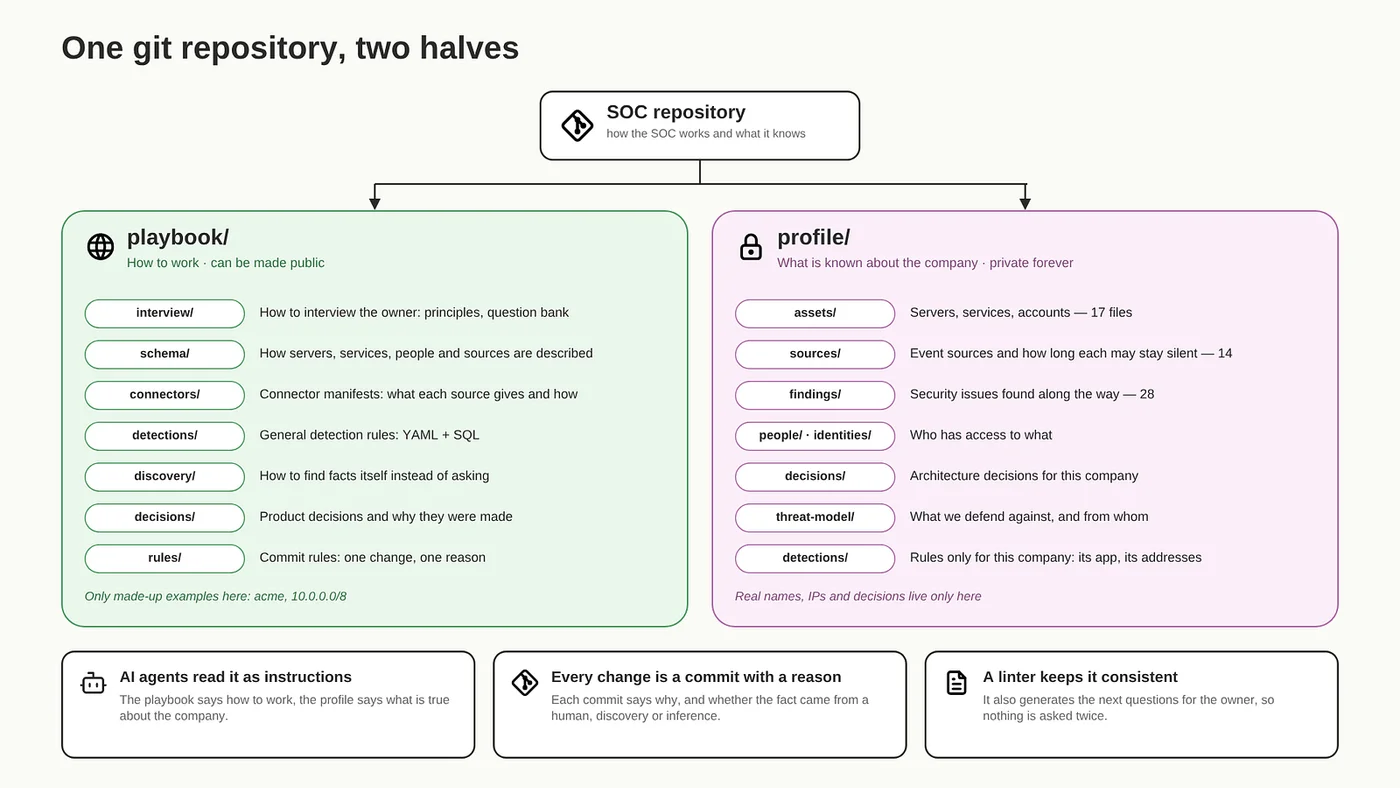
Since I’m building this SOC with active help from AI, I decided to write down all its working principles, architectural decisions and processes in a single git repository. This way I’ll get a fully reproducible SOC from a git repository, which can be used for other projects in the future. The repository is split into two parts. The first is “how to work”: working principles, the infrastructure description schema, general detection rules, connector descriptions; this part can be opened up in the future. The second is “what is known about the company”: servers, services, people, decisions made; it will stay private forever. This repository is also a convenient place for a registry of sources and of discovered infrastructure security issues, so you can gradually connect those sources and fix the issues.
CONNECTING SOURCES
Next I started connecting event sources. There are a lot of nuances in this part: some sources send logs themselves, others give you a log via API, and others give you nothing except the current state. For example, it turned out that the email provider Purelymail has no log at all, and an API token can only have full rights, like root. Of course, I created a ticket with a feature request for more granular access. We’ll wait. It also turned out that GitHub without an Enterprise subscription gives data in three different ways, and none of them covers everything. Below I’ll tell you about the main nuances of all the sources I’ve managed to connect so far.
SERVER LOGS
Server logs are sent by the Wazuh agent: it reads the system journal, which has SSH logins, Docker events and everything the services write. Everything was simple here.
MAIN APPLICATION LOGS
Only these logs tell you what’s really happening inside the product itself. The application writes security events to the system journal, and the same Wazuh agent picks them up from there — no separate integration was needed.
I had to ask an LLM to study the project’s code and documentation and find the gaps in logging. There turned out to be a lot of them. For example, an expired session token and a forged one looked the same in the logs, although the first is a normal thing and the second is a sign of an attack. A password reset request was logged without the source IP, and on password login, instead of the user’s IP address, the logs had one shared Cloudflare IP address. And successful use of a machine API token wasn’t logged at all, so if the token leaked, nobody would notice its illegitimate use.
The LLM described which new logs and which fields in existing ones need to be added, and handed the task to the agent that develops the main application. Based on the application events we designed 31 detections together: 28 are Wazuh rules, three are for the separate detector, because they need history that Wazuh doesn’t take into account.
CONTABO CLOUD (the hosting where my VMs live)
The connector pulls the Contabo audit log via API every 10 minutes. The SOC can see who created or rebooted a server, changed the firewall or added a key, and even the channel — by hand in the panel or via API. The 8 months of history showed that more than half of the records are actions of the provider itself.
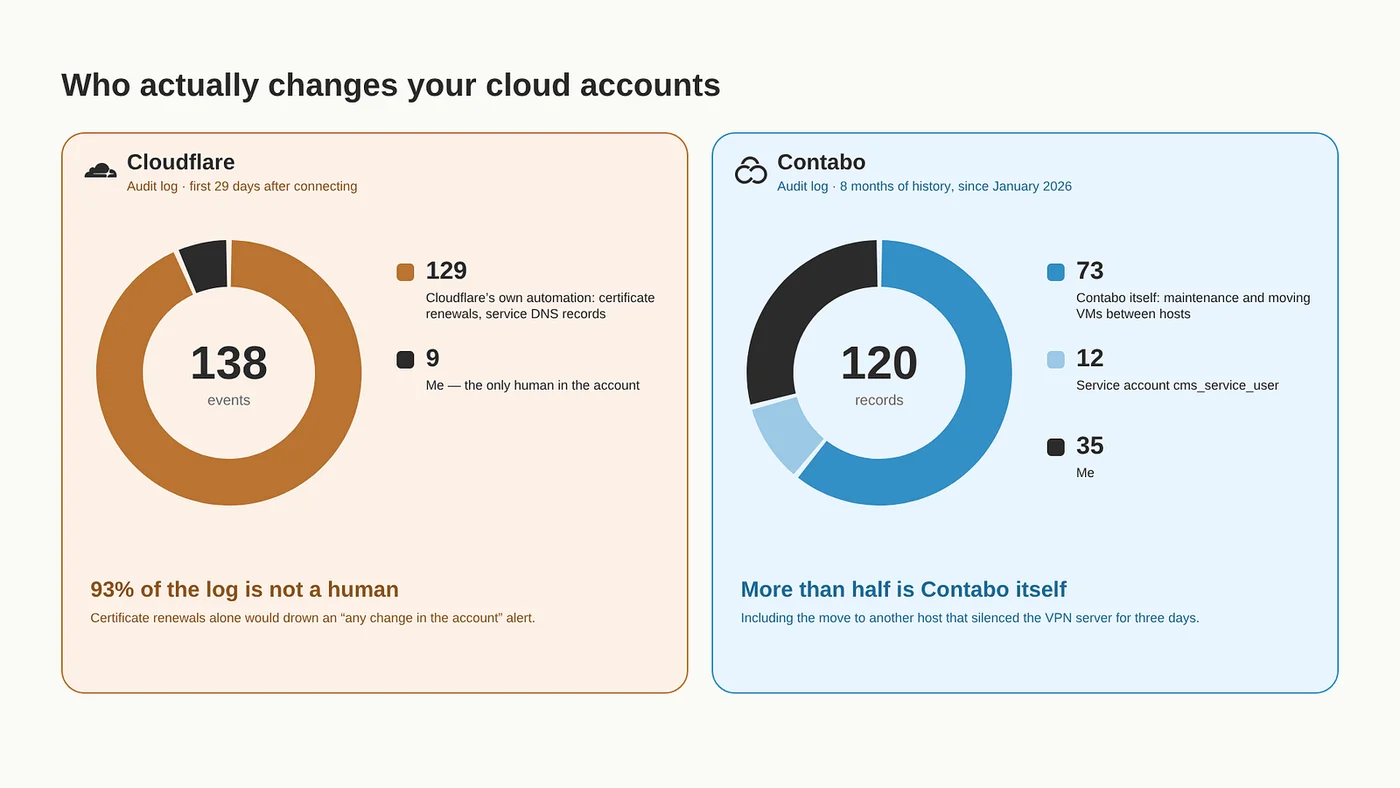
The log has already come in handy. One of the servers suddenly went silent, and it was the Contabo log that explained why: the provider moved the server to other physical hardware and rebooted it.
CLOUDFLARE
For me this is a critical source: all external access to the backend goes through a Cloudflare tunnel, and if someone gets access to the admin panel, they can redirect the tunnel. At the moment I’ve connected only the account audit log. It shows both logins to the account and any changes — issuing a token, editing a tunnel or DNS, including who did it and from which IP address.
For the first month of history 138 events came in, and 129 of them were Cloudflare’s own automation: certificate renewals and service DNS records. Only nine were my actions.
What’s not visible yet: tunnel outages, DDoS and certificate expiry. These aren’t human actions, so they’re not in the audit log — they only come as notifications via a webhook, which I haven’t set up yet.
EMAIL: Purelymail
This is the most unusual source: this email provider has no log at all, you can only get the current state via API. So every 15 minutes the connector takes a snapshot of the settings, compares it with the previous one and writes only the difference. A token can only be created with full rights. I hope Purelymail will add granular token permissions and an audit log in the future.
What you can see with this setup: for example, it will detect if a new recovery address or a new forwarding rule was added — two classic ways to quietly persist in someone else’s mailbox. Plus disabling the second factor, broken mail DNS records, running out of money on the account, etc.
What, unfortunately, you can’t see: mailbox logins, who made a change and exactly when, and a change that was rolled back between two snapshots.
GITHUB
A personal account doesn’t have a full audit log, so first I had to move the repositories into an organization, where the log is available. But without an Enterprise subscription you can’t automate exporting the log, it can only be done manually from the UI.
I didn’t want to buy the subscription at this stage, so I had to come up with my own way, combining different methods of getting information from GitHub.
I got the visibility I needed through webhooks and API polling on behalf of a GitHub App — a service account of the organization with a special set of read-only permissions.
Webhooks instantly show everything that happens with code and repositories (commits, repository visibility changes, new deploy keys, etc.), and the GitHub App lets me regularly take a snapshot of the settings and detect changes: for example, an app being installed in the organization, required two-factor being turned off, etc.
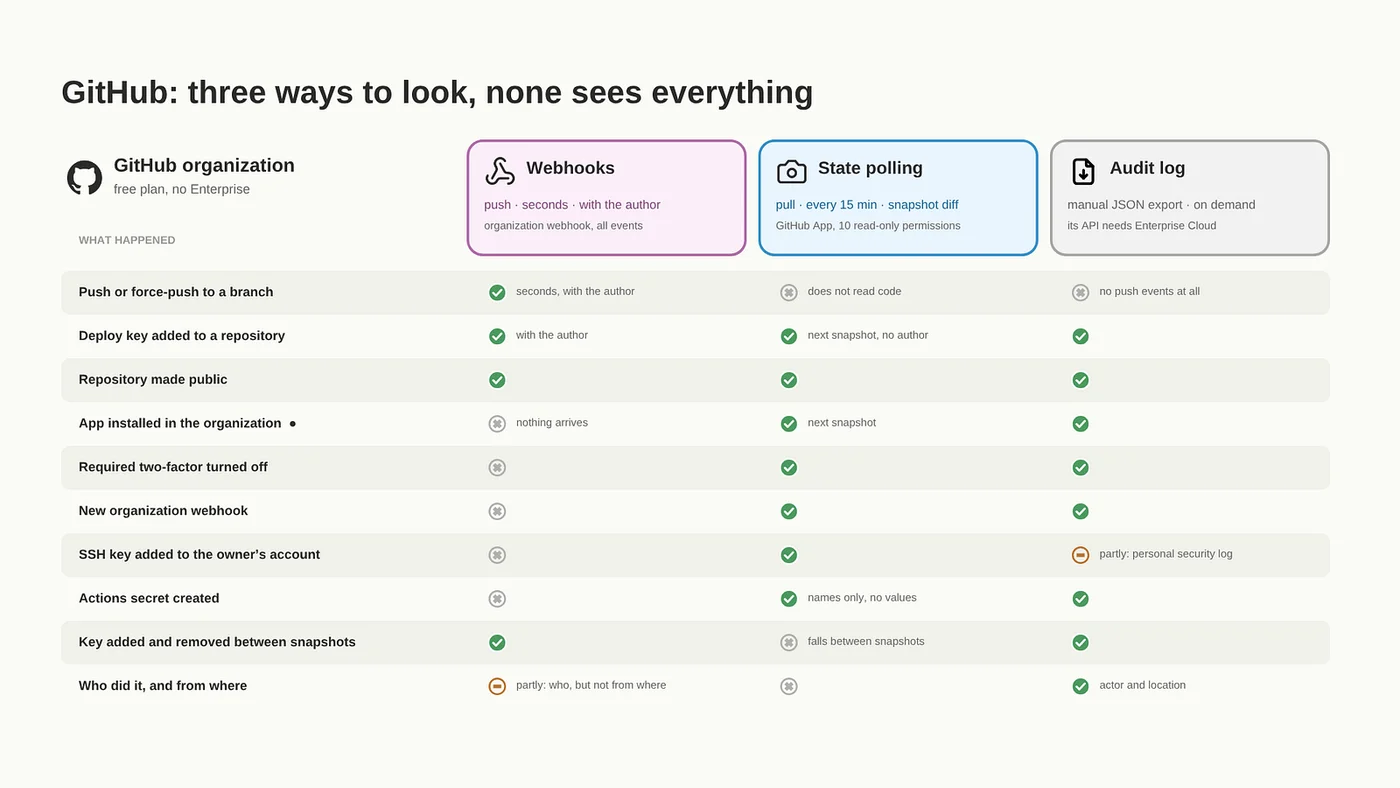
But for deeper investigations the audit log is sometimes still necessary — only there can you see who changed settings and from where. So when needed, the SOC can request a manual export of the log: GitHub lets you export it as JSON.
MANAGING SOURCES
A separate pain is sources that silently drop off. A SOC that stopped receiving logs and doesn’t know about it is worse than no SOC at all.
I ran into this when the Wazuh agent on one of the servers didn’t come back up properly after a reboot: the service was listed as running, the connection to the SOC was open, but no data was coming. For three days I didn’t see this server and didn’t know about it.
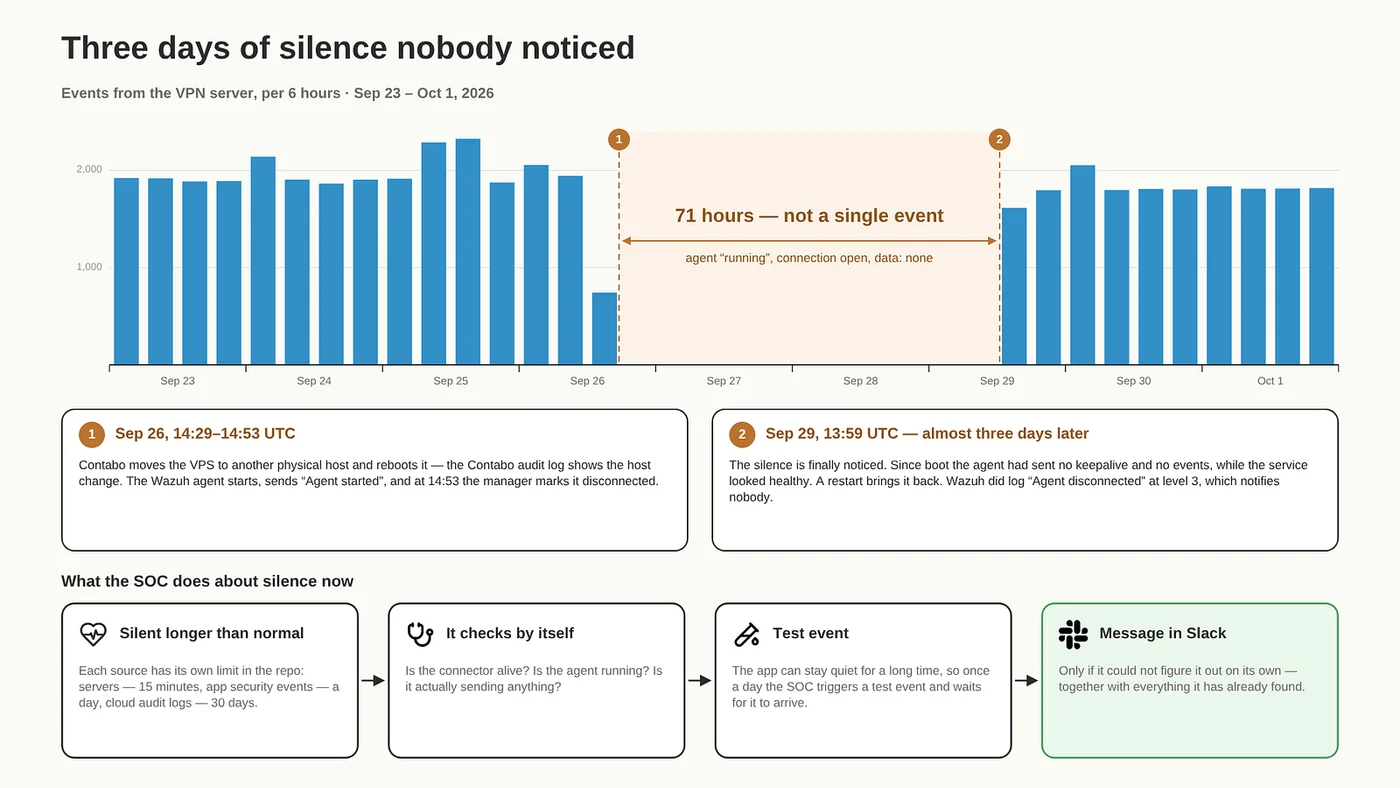
After that I made a separate service that monitors the state of sources. For each source the repository records how long it’s normal for it to be silent: servers and the application send events constantly, while, for example, a cloud audit log can be silent for several days. If a source is silent longer than normal, the service first checks it itself: is the connector alive, is the agent on the server working, and is it sending anything. For the application, which can be silent for a long time, once a day it triggers a test event itself and checks that it reached the SOC. And only if the service couldn’t figure it out on its own does it message me in Slack — right away with what it has already found out.
WHAT THE SOC HAS ALREADY FOUND
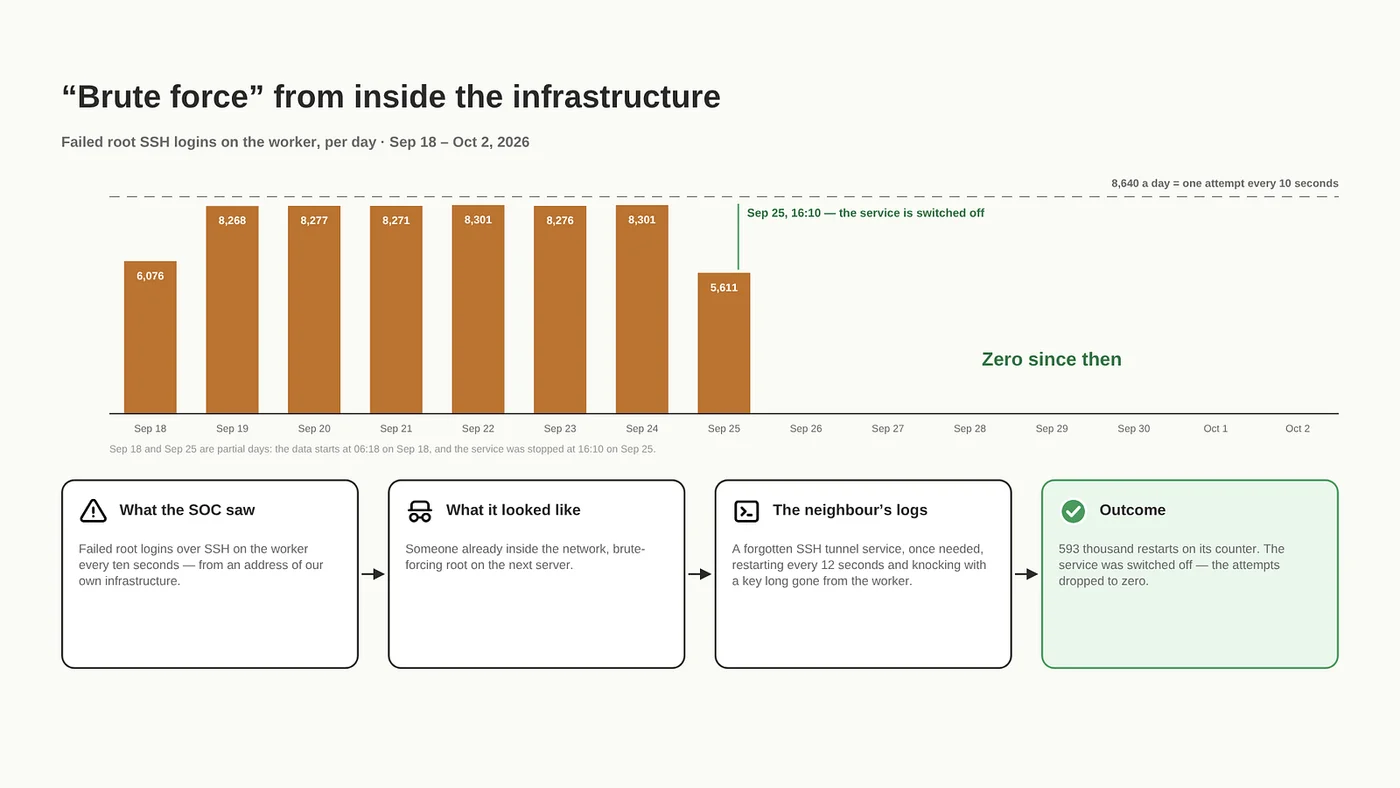
The first thing the SOC detected was hundreds of broken-off attempts to log in via SSH as root, every ten seconds, from an address of our own infrastructure. It looked like someone brute-forcing from the inside. The answer was in the logs of a neighboring server: a forgotten old service — an SSH tunnel that was once needed — was restarting every 12 seconds and banging on the worker with a key that had long been gone from there. Its restart counter reached 593 thousand. The service was turned off — thanks, SOC!
Also, after getting the first data from GitHub via API, it turned out that the production server’s key to the repository had write access by mistake. So compromising the production server would also have allowed changing code in the repository. This was fixed too.
Besides that, a lot of small things were found, but I’ll tell you about them later.
And the SOC really does live on one server. Right now it receives on average 55–75 thousand events per day. And that’s taking into account that we filter out some useless events on Vector (about 100 thousand events per day). The whole SOC takes about 2.4 GB of RAM: 1.5 GB is ClickHouse, 0.5 GB is Wazuh, the rest is connectors and services at a few dozen megabytes each. A day of logs takes about 8 MB on disk: ClickHouse compresses them almost 8 times, about 110 bytes per event on average, so a year of logs at the current flow will fit in about 3 GB.
WHAT’S NEXT
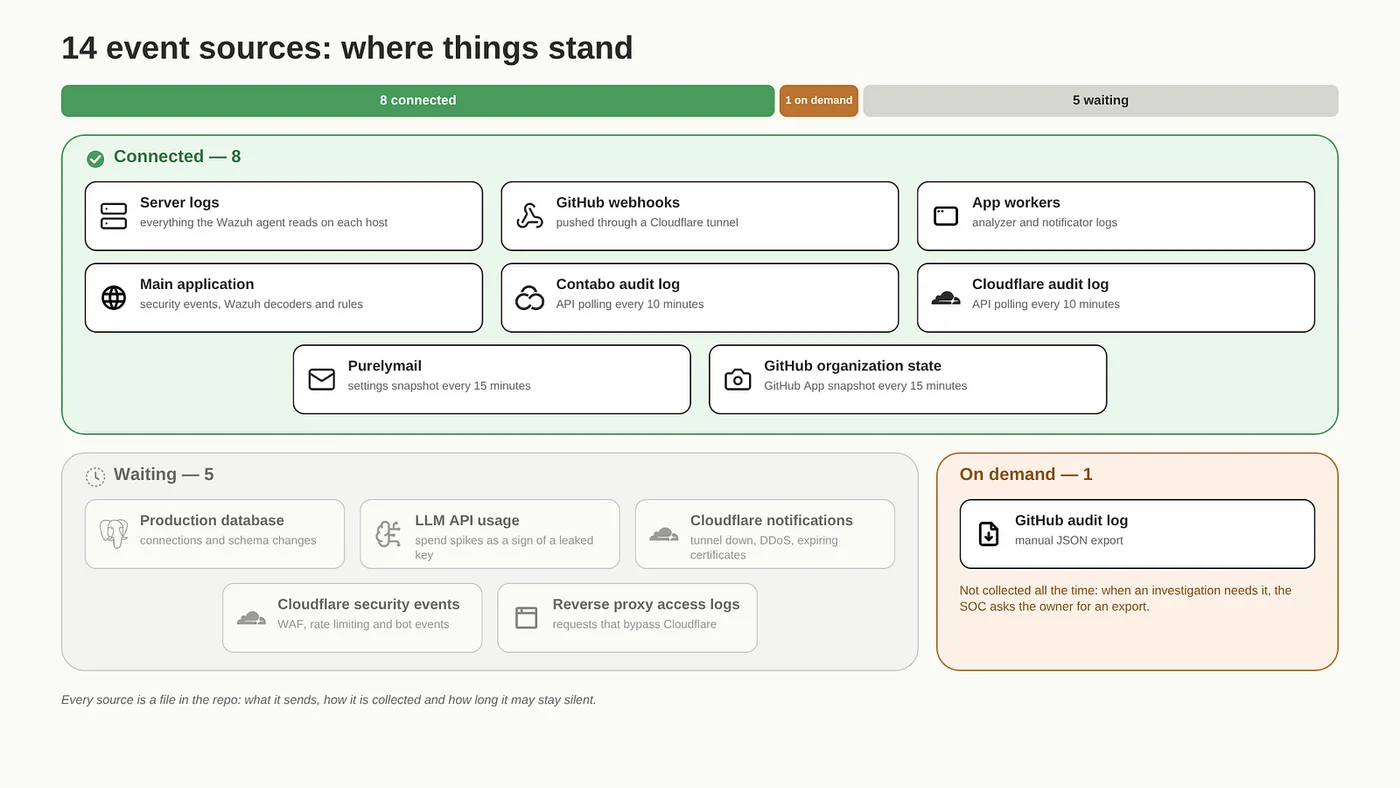
Right now the SOC sees the servers, the main application and the main cloud services, watches by itself that nothing drops off, and already in the first days showed me things I hadn’t noticed. At the same time six more sources are waiting to be connected — the database, the LLM service, Cloudflare webhooks and others.
So a SOC for a small project is already possible, and it’s not a team of ten people and not an expensive subscription. It’s one server, a set of open-source products and a little spending on AI tokens.
In the next articles I’ll tell you how the correlator turns alerts into incidents, about my experiments with AI agents that run investigations and try to respond to incidents on their own, and also how much all this costs.
If you’re building something similar, follow me here or on LinkedIn: www.linkedin.com/in/denzuikov Later I plan to open the “how to” part of the repository, I’ll announce it there.
Originally published on SubstackAlso on Medium
Subscribe to new articles
One email when a new post is out. Nothing else.